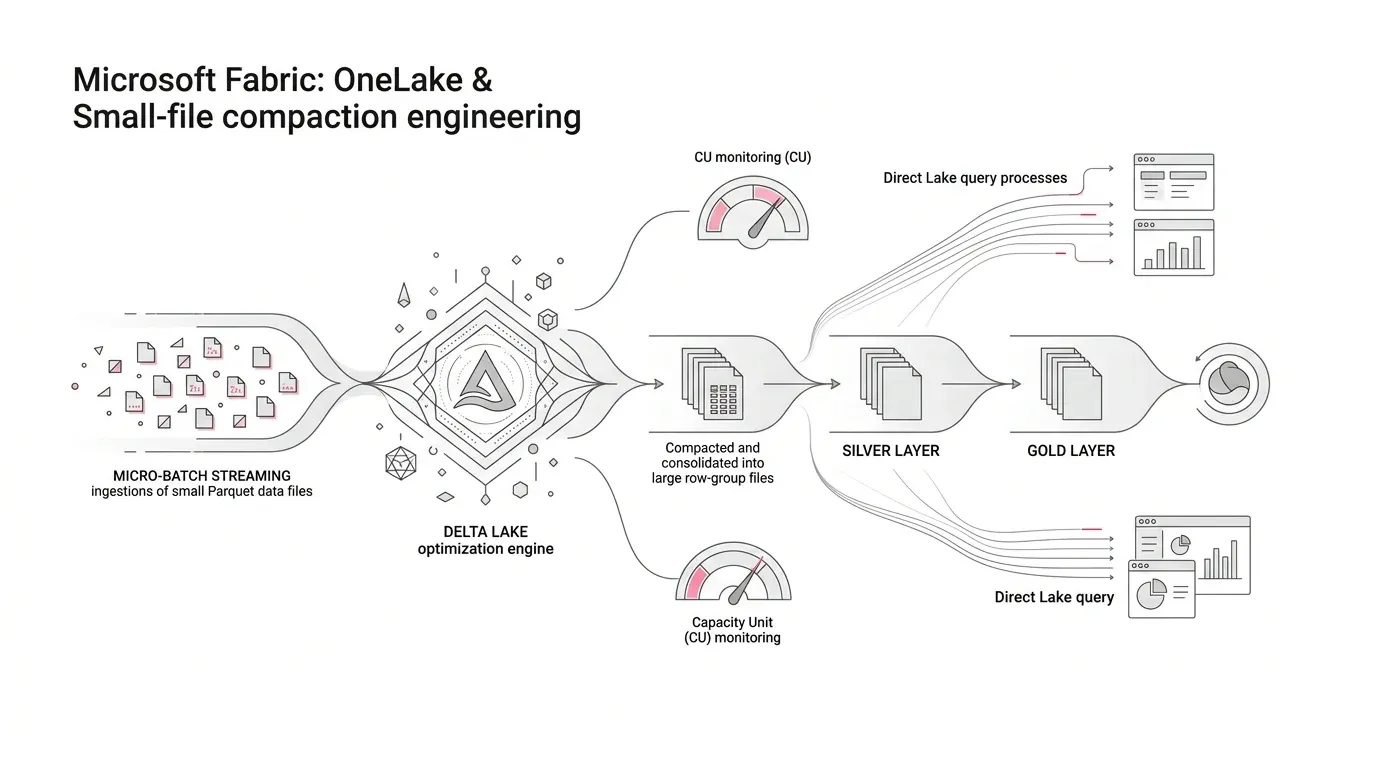
Frequent micro-batches, streaming ingestion, excessive partitioning, and row-level updates can quietly degrade a healthy Microsoft Fabric Lakehouse into thousands or millions of tiny Parquet files . While the underlying business data remains correct, every Spark transformation, SQL analytics query, Direct Lake semantic model, storage scan, and maintenance job must navigate a highly fragmented physical storage layout.
Core Engineering Principle: The solution to small-file debt is not a blanket nightly OPTIMIZE across every table. A sustainable Fabric table-health operating model prevents fragmentation at write time, aligns compaction with Direct Lake framing, and measures Capacity Unit (CU) efficiency alongside business latency.
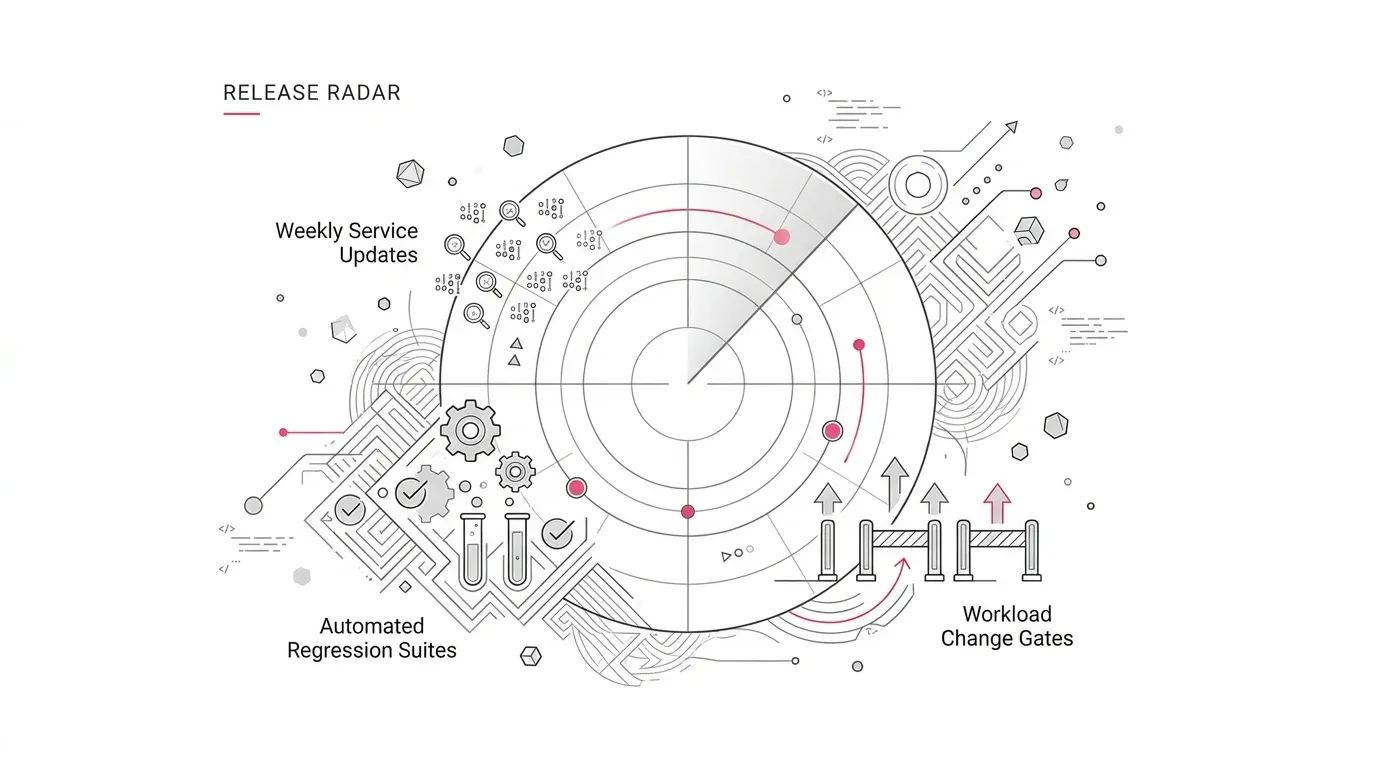
The issue becomes critical in late 2026. Microsoft has announced that, beginning October 15, 2026 , certain OneLake operations performed by Apache Spark workloads that were not previously reflected in reported capacity consumption will now be metered. While underlying consumption rates are not changing, organizations with high operational transaction volumes may observe higher reported Capacity Unit (CU) consumption. Furthermore, Microsoft documentation confirms that every file smaller than 4 MB still counts as a full OneLake transaction .
A fragmented file layout creates both an ongoing query latency penalty and an unnecessary transaction-cost multiplier. Rather than scheduling brute-force compaction jobs across entire lakehouses, enterprise data leaders need a structured table-health operating model that balances write-time prevention, selective maintenance, Direct Lake coordination, and capacity telemetry.
The Enterprise Problem: Correct Data, Inefficient Physical Layout
A Delta Lake table is not a monolithic file. It is a collection of Parquet data files accompanied by an ACID transaction log (_delta_log) that tracks which specific files constitute each table version. While this architectural design enables multi-engine concurrency, time-travel audits, and schema evolution, it means that physical file layout directly dictates compute performance.
When ingestion pipelines append small batches every few minutes, each commit produces dozens of small physical files. Downstream MERGE, UPDATE, and DELETE operations rewrite files, while multi-level directory partitioning fragments already-small batches into even smaller chunks. As file counts multiply into the tens of thousands, compute engines expend significant CPU cycles listing files , reading object metadata, scheduling task partitions, and merging row-group dictionaries before analyzing a single row of data.
Microsoft file-size guidance is unequivocal: undersized files inflate task overhead and metadata operations, while oversized files restrict compute parallelism and trigger I/O skew. Microsoft Fabric provides OPTIMIZE , auto compaction, optimize write, and adaptive target file sizing to maintain this equilibrium.
Crucially, this is not merely a Spark engineering nuance. Properly sized Parquet files directly benefit the SQL analytics endpoint, Apache Spark, and Power BI Direct Lake . Microsoft Direct Lake guidance specifically mandates keeping the number of Parquet files small and utilizing large row groups to minimize column transcoding overhead and memory paging during user queries.
Why Small-File Governance Matters Now
Three simultaneous industry dynamics make OneLake storage optimization an executive priority:
- Capacity Metering Expansion: From October 15, 2026, Microsoft will incorporate previously unmetered Spark-driven OneLake storage operations into reported CU consumption. Workloads generating millions of sub-4 MB file transactions will see immediate spikes in reported utilization.
- Multi-Engine Contention: A single Gold Delta table frequently serves Spark pipelines, SQL analytics endpoints, and executive Direct Lake models. An inefficient physical layout imposes a cumulative latency tax across all business consumers.
- Real-Time Ingestion Demands: The business appetite for near-real-time operational intelligence leads teams to shorten ingestion intervals from hourly batches to 5-minute micro-batches without redesigning underlying storage maintenance.
Data leaders should avoid interpreting post-October increases in reported CUs as a pricing change or an automatic signal to buy larger capacity tiers. Fabric administrators should utilize the Fabric Capacity Metrics App to isolate whether spikes stem from business data growth, new reporting, or avoidable small-file transaction debt.
Representative Scenario: The Degraded Gold Fact Table
Representative Scenario: A national services provider deploys a Fabric Lakehouse to unify omnichannel customer interactions. Events arrive from CRM, contact centers, and web portals every five minutes. Six months post-launch, the primary Gold interaction fact table receives over 280 commits daily, is partitioned across four low-cardinality fields, and is subjected to an unpartitioned hourly MERGE. Nightly full-table OPTIMIZE jobs rewrite healthy data, triggering severe cold-query latency in executive Direct Lake dashboards each morning.
No individual pipeline in this scenario was poorly coded. The breakdown occurred across departmental boundaries: ingestion engineers optimized for 5-minute freshness, transformation developers built complex MERGE queries, BI analysts modeled Direct Lake measures, and platform administrators observed rising unallocated CUs. Nobody owned the table's end-to-end physical layout health.
Root Causes and Systemic Consequences
1. Freshness Treated Merely as Write Frequency
Shortening a pipeline trigger from sixty minutes to five minutes increases commit frequency twelvefold. If each run writes one or more files per partition, physical file proliferation outpaces underlying business data volume by orders of magnitude. Business freshness must be designed as an end-to-end service-level objective (SLO)—encompassing ingestion, compaction, semantic framing, and query response—not simply a cron schedule.
2. Partitioning Mirrored Business Hierarchies Rather Than Data Scale
Engineering teams frequently partition tables by region, channel, year, and category simultaneously. Physical partitions are not a replacement for columnar indexing or semantic model relationships. High-cardinality partitioning produces sparsely populated directories containing kilobyte-sized files. For Direct Lake, Microsoft warns that excessive partitioning multiplies Parquet files and memory segments, recommending low-cardinality partition columns with fewer than 100 to 200 distinct values .
3. Universal Assumptions on Default Settings
Fabric workspace resource profiles introduce deliberate performance trade-offs. New workspaces default to a writeHeavy profile , optimizing Spark ingestion throughput with V-Order disabled. Conversely, the readHeavyForPBI profile activates V-Order optimization for Direct Lake acceleration. Relying on default workspace settings across diverse Bronze, Silver, and Gold workloads creates systemic misalignments.
4. Calendar-Driven Maintenance Over Evidence-Driven Compaction
Scheduling blanket nightly OPTIMIZE tasks rewrites healthy, already-compacted data, wastes Spark capacity, and invalidates cached Direct Lake column segments that must subsequently be transcoded from scratch. Too little maintenance permits fragmentation to strangle performance; excessive maintenance burns compute credits and degrades the user experience.
5. Retention Cleanup Misunderstood as a Performance Lever
The VACUUM command permanently purges unreferenced, historical files past an established retention threshold. It does not consolidate active small files and does not directly enhance Direct Lake performance, as Direct Lake queries read only the active snapshot. Arbitrarily reducing retention periods below the 7-day default compromises time-travel recovery and risks failing active readers without improving query speeds.
Why Common Emergency Responses Fall Short
When small-file debt begins impacting report responsiveness, organizations often implement well-intentioned shortcuts that exacerbate the problem:
- 'Run OPTIMIZE across all tables every night': Treats static lookup tables and volatile fact tables identically, incurring high compute rewrite costs while repeatedly clearing Direct Lake memory caches.
- 'Enable V-Order across every workspace': While V-Order optimizes Parquet layout for read-heavy Power BI reporting, it incurs additional write-time CPU overhead and provides zero value for transient staging tables.
- 'Add more directory partition keys': Exchanging query scan filtering for directory proliferation fragments tables into sub-megabyte files, crippling storage transactions and Direct Lake transcoding.
- 'Scale up to a larger Fabric capacity tier': Increasing capacity masks unoptimized physical file layouts with expensive compute, permanently inflating recurring operational costs while leaving the underlying architectural bottleneck unaddressed.
- 'Aggressively shorten VACUUM retention to 24 hours': Destroys Delta Lake time-travel recovery capabilities and causes catastrophic query failures for long-running batch readers or framed Direct Lake models.
A Two-Speed Microsoft Fabric Solution: The Table-Health Control Loop
A robust OneLake architecture separates primary data ingestion pipelines from an autonomous control plane that observes, governs, and maintains physical storage layout:
Operational Sources (APIs, Streaming, ERP, CRM, IoT)
        |
        v
Bronze Delta Tables
Append-oriented, write-heavy settings, raw immutable history
        |
        v
Silver Delta Tables
Validated schemas, bounded MERGE windows, Liquid Clustering / balanced layout
        |
        v
Gold Delta Tables
Read-optimized layout, selective V-Order, large row groups, stable contracts
        |
        +-------------------+-------------------+
        v                   v                   v
  Apache Spark       SQL Analytics Endpoint   Direct Lake Semantic Models

Control Plane Across All Layers:
Inventory -> Measure -> Classify -> Prevent -> Compact -> Validate -> Report
1. Inventory Tables and Assign Workload Service Classes
Build a centralized metadata catalog linking technical storage parameters to business criticality. Classify every Delta table into one of four distinct service classes:
- Critical Interactive: Gold fact and dimension tables feeding executive Direct Lake models. Requires strict file-size targets (512 MB to 1 GB), V-Order optimization, and off-peak compaction windows.
- Shared Analytical: Silver curated datasets queried concurrently via SQL analytics endpoints and Spark notebooks. Requires balanced file sizes (256 MB to 512 MB) and bounded MERGE write policies.
- Engineering Intermediate: Bronze landing tables and transient transformation stages. Prioritizes raw append speed with writeHeavy profiles, skipping V-Order.
- Historical Archive: Cold compliance and historical snapshot stores. Maintained with aggressive file consolidation and extended retention policies.
2. Establish Baseline Telemetry Before Modifying Configurations
Prior to modifying Spark environments or scheduling maintenance, establish empirical baselines across two complete business cycles. Measure total active file count, file size distribution, proportion of files below 4 MB , Delta log commit frequency, Direct Lake warm/cold p95 query duration, and baseline Capacity Unit (CU) consumption.
3. Prevent Small-File Fragmentation at Write Time
Preventing physical fragmentation during ingestion is dramatically more cost-effective than continuous post-write remediation:
- Align Environment Resource Profiles: Enforce writeHeavy profiles on Bronze ingestion notebooks, and apply readHeavyForPBI profiles on curated Silver and Gold transformation pipelines.
- Activate Optimize Write Selectively: Use optimize write on partitioned tables or complex MERGE/UPDATE pipelines to perform pre-write bin packing, creating fewer and larger Parquet files.
- Leverage Adaptive Target File Sizing: Fabric Runtime 2.0 enables adaptive target file sizing by default, dynamically calculating optimal target sizes based on table volume. On Runtime 1.3, enable this feature explicitly.
- Coalesce Ingestion Batches: Decouple source polling from Gold publication. A 5-minute streaming ingest into Bronze should be consolidated into a 15-minute or 30-minute change publication for Gold Direct Lake tables.
- Constrain Change Predicates: Apply strict partition or date-range pruning predicates to all MERGE operations, preventing Spark from scanning and rewriting historical files unnecessarily.
4. Execute Compaction Based on Health Thresholds and Demand
Execute OPTIMIZE selectively when empirical metrics justify the compute cost. Fabric Lakehouse maintenance can be orchestrated through notebooks, Fabric pipelines, or REST APIs. Apply this operational decision rule:
Trigger Delta Compaction when:
  (Active sub-4MB file count / Total files) > 25%
  AND Expected query latency & OneLake transaction savings > Compute rewrite cost
  AND Downstream reporting service-level objectives (SLOs) are protected
5. Coordinate Table Compaction with Direct Lake Framing
Because compaction creates new Parquet files, framed Direct Lake models must reload and transcode updated column data. To eliminate executive dashboard disruptions:
- Schedule heavy compaction exclusively during low-traffic overnight or weekend maintenance windows;
- Scope compaction to actively modified partitions rather than executing blanket full-table rewrites;
- Trigger an automated semantic model refresh immediately following compaction completion;
- Execute automated warm-up queries against top dashboard visuals to pre-load column caches; and
- Verify p95 response times before opening the reporting window to business users.
6. Strictly Decouple Compaction from Retention Policies
Treat compaction and retention as two distinct operational controls with separate governance owners. Compaction rewrites active data for performance and transaction efficiency. VACUUM permanently removes obsolete historical files to control storage costs. Maintain the default 7-day retention safety buffer to safeguard time-travel auditing and prevent deleting files required by active Direct Lake models.
7. Close the Governance Loop with Capacity Metrics
Monitor the Fabric Capacity Metrics App to track normalized efficiency metrics, such as CU seconds consumed per million ingested records or CU seconds per Gold table publication. Normalizing compute against business throughput ensures that capacity fluctuations reflect genuine operational efficiency rather than shifting data volumes.
Phased Implementation Roadmap: Preparing for October 15
- Phase 0: Establish the October 15 Baseline (Days 1–5): Freeze nonessential storage changes. Export pre-change capacity, OneLake operation counts, and Spark runtimes across all workspaces. Identify pipelines generating excessive small files.
- Phase 1: Diagnose Top Data Products (Weeks 1–2): Map the top five mission-critical Gold tables. Benchmark file distributions, sub-4 MB counts, Direct Lake warm/cold latencies, and Spark compute CUs.
- Phase 2: Eliminate Write-Time Fragmentation (Weeks 2–4): Configure managed Spark resource profiles. Enable adaptive file sizing, apply selective optimize write, constrain MERGE predicates, and replace excessive partitioning with Liquid Clustering where appropriate.
- Phase 3: Remediate Accumulated Storage Debt (Weeks 4–6): Execute scheduled, partitioned compaction during approved maintenance windows. Apply V-Order to read-heavy Gold tables and coordinate Direct Lake cache warm-ups.
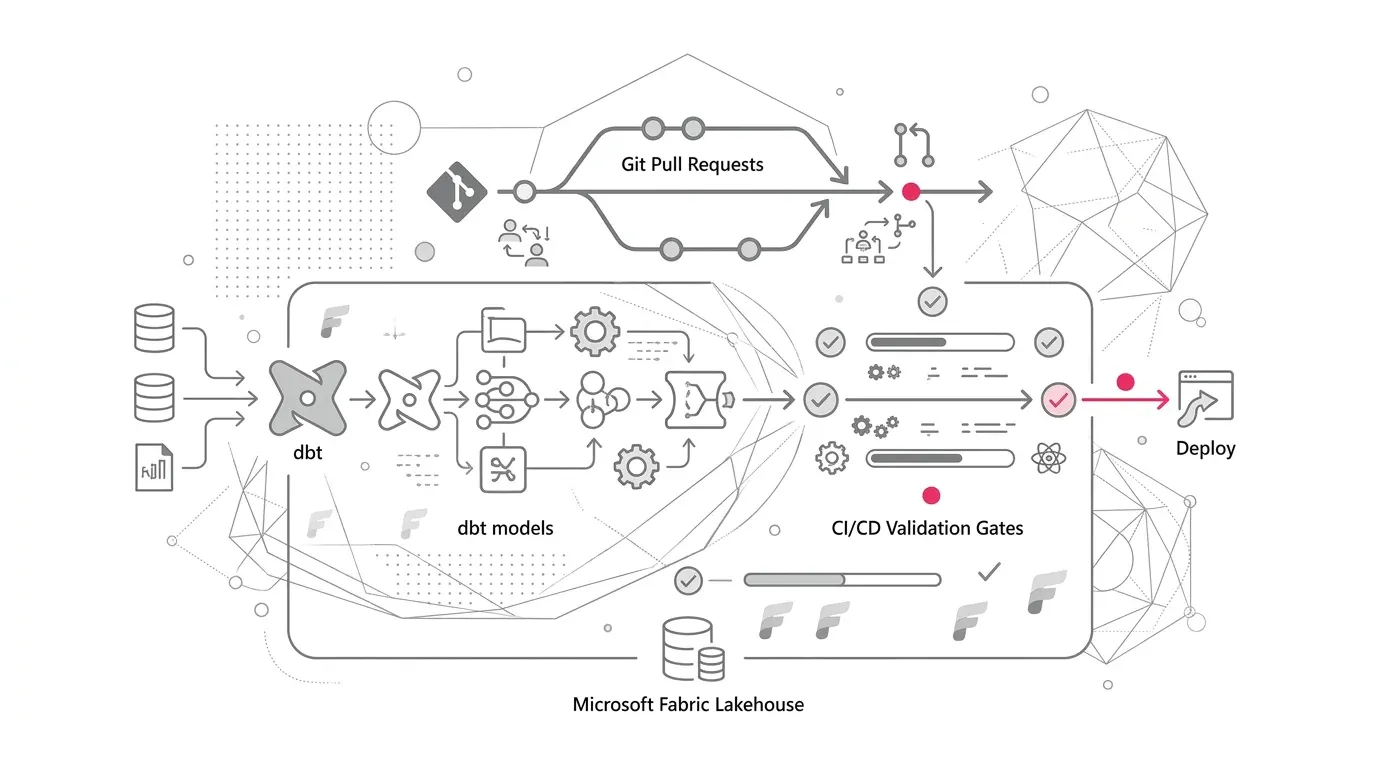
- Phase 4: Operationalize Across Domains (Weeks 6–10): Publish enterprise table-health policies, automate telemetry alerting, integrate runbooks with enterprise CI/CD, and review capacity sizing using empirical utilization data.
Enterprise Storage Governance & Performance Scorecard
| Performance Dimension | Key Operational Metric | Strategic Value & Governance Purpose |
|---|---|---|
| Physical Storage Layout | Active file count, median file size, % of files < 4 MB, row groups per table | Validates that compaction is eliminating small-file sprawl and transaction penalties. |
| Pipeline Freshness | Source-to-Gold p95 publication latency | Ensures maintenance routines do not delay business data availability beyond agreed SLOs. |
| Interactive User Experience | Direct Lake cold/warm p95 query duration, SQL endpoint latency | Directly links underlying Parquet optimization to executive dashboard responsiveness. |
| Capacity Efficiency | CU seconds consumed per million records processed | Normalizes compute utilization against varying business data volumes. |
| Maintenance Health | Compaction runtime, bytes rewritten, failure rate | Exposes the computational cost of maintenance against realized query improvements. |
| Resilience & Compliance | Retention-policy exceptions, time-travel audit verification | Guarantees that aggressive cleanup routines do not compromise data recovery or governance. |
| Incident Management | Production alerts linked to stale Direct Lake framing or capacity throttling | Measures whether table-health governance is reducing operational fire drills. |
How YuniQ Accelerates OneLake Performance & Cost Optimization
YuniQ delivers comprehensive enterprise consulting and implementation services for Microsoft Fabric to help organizations master OneLake performance, storage architecture, and capacity governance:
- Fabric Strategy & Readiness Assessments: Workload diagnostics, F-capacity sizing, workspace topology, and small-file debt remediation planning.
- OneLake Medallion Architecture: High-throughput ingestion pipelines, Dataflow Gen2 tuning, Lakehouse optimization, and Liquid Clustering design.
- Direct Lake Performance Optimization: Parquet layout restructuring, V-Order tuning, row-group sizing, and automated semantic model framing.
- Governance & Automated DevOps: Least-privilege Entra ID security, Purview lineage integration, automated table maintenance pipelines, and Capacity Metrics alerting.
Eliminate OneLake Small-File Debt Before Capacity Costs Rise
Don't wait for October 15 capacity updates to impact your Microsoft Fabric budget or degrade executive dashboards. Partner with YuniQ for an end-to-end OneLake storage diagnostic, Delta Lake compaction engineering, and Direct Lake performance optimization.
Explore Microsoft Fabric ConsultingSix Practical Next Steps for Data Engineering Teams
- Capture an immediate pre-October 15 telemetry baseline across capacity consumption, OneLake operation counts, and Spark runtimes.
- Identify your highest-leverage Gold Delta tables exhibiting frequent micro-batch commits and elevated sub-4 MB file ratios.
- Trace end-to-end data flow: document write cadences, partition structures, MERGE logic, Direct Lake models, and existing maintenance scripts.
- Execute a controlled benchmark testing adaptive file sizing, optimize write, and selective compaction against current configurations.
- Deploy the optimized write and maintenance policy through managed Fabric environments, validating Direct Lake query improvements.
- Establish continuous table-health monitoring, scaling capacity only when substantiated by empirical business growth.