Microsoft Fabric brings data integration, engineering, warehousing, real-time analytics, and business intelligence into one platform. That does not automatically create one operational view.
An enterprise may have pipeline run history in one place, workspace logs in another, capacity utilization in a separate app, and tenant adoption data in an administrator report. Each tool is useful, but a responder still has to answer the business question: Which data product is unhealthy, who owns it, what business commitment is at risk, and what should happen next?
Core Architectural Finding: Monitoring reports known component states such as failed, running, or throttled. Observability combines cross-plane signals and service context so teams can explain unexpected states, protect business SLOs, and act before consumers report stale data.
The solution is an observability operating model, not a larger dashboard. It should:
- Define service-level objectives (SLOs) for business-critical data products;
- Correlate job, item, workspace, capacity, and tenant signals;
- Route actionable alerts to named owners with tested runbooks;
- Preserve the telemetry needed for trend analysis and audit requirements;
- Protect sensitive operational metadata; and
- Make monitoring cost and reliability part of capacity planning.
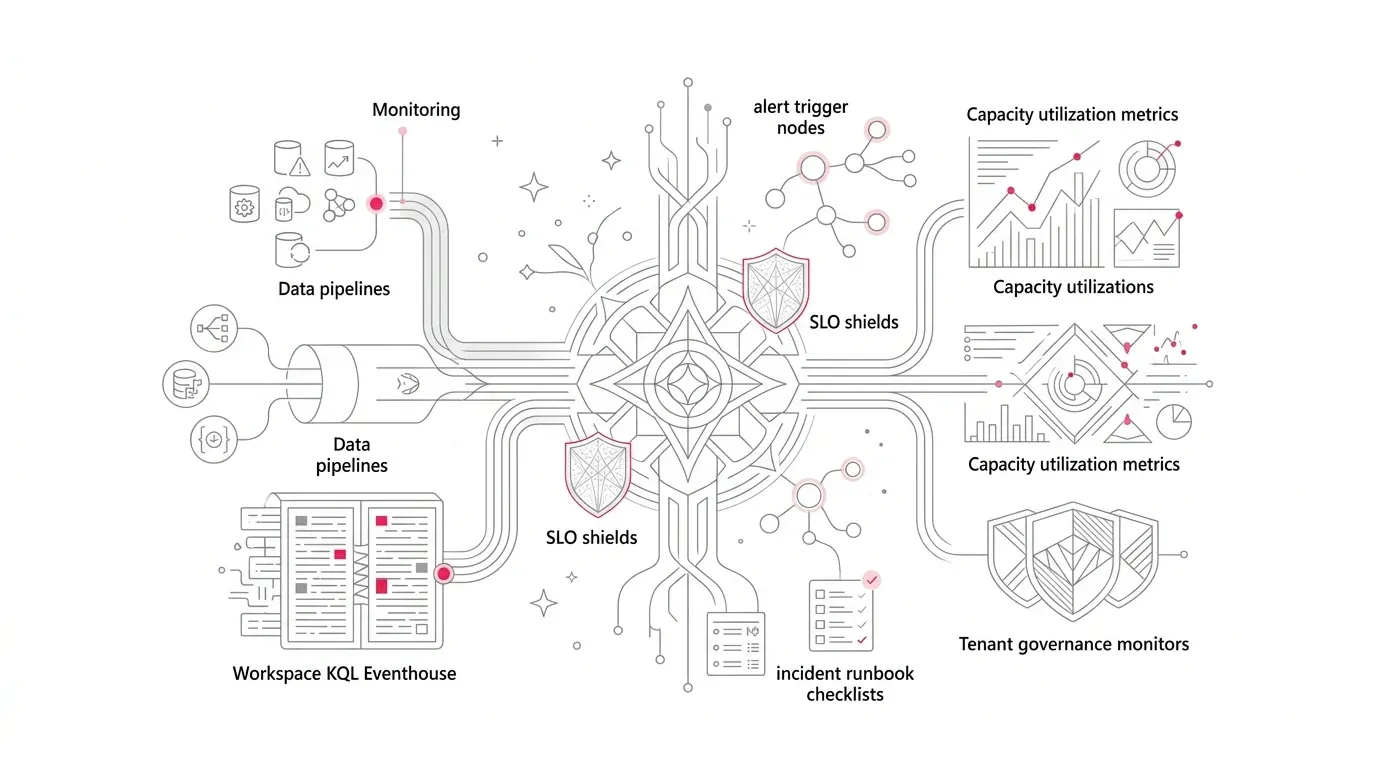
Microsoft Fabric provides the foundational building blocks. The monitoring hub shows current and recent job activity visible to the signed-in user. Workspace monitoring places supported logs and metrics in a queryable Eventhouse database. The Fabric Capacity Metrics app attributes recent compute use and throttling. The Admin monitoring workspace supports tenant-level usage and governance analysis. Fabric Activator can evaluate KQL query results and send notifications.
The implementation challenge is to connect those planes to a common service catalogue and response process without overstating the maturity of preview capabilities.
The Enterprise Problem: Telemetry Exists, but Accountability Is Fragmented
Most Fabric incidents do not begin as obvious platform outages. They begin as a missed load, an unusually slow notebook, a semantic-model operation that exceeds its normal duration, an Eventstream error, or capacity pressure that delays an otherwise healthy workload.
The business sees a stale dashboard or a late operational file. The engineering team sees a failed activity. The capacity administrator sees utilization and throttling. The Fabric administrator sees tenant activity. Each view is valid, but none alone describes the end-to-end service.
This fragmentation creates five operational risks:
- Failures are detected by consumers: A finance or operations user becomes the monitoring system when they report stale data;
- Symptoms are confused with causes: A failed refresh may result from an upstream pipeline, a permissions change, a source outage, or capacity contention;
- Criticality is invisible: A failed development job and a failed regulatory feed can look equivalent without business context;
- Ownership is inferred during an incident: Workspace names and item creators are poor substitutes for an accountable service owner and escalation path; and
- Operational evidence expires or remains inaccessible: Investigation and audit needs can outlive the retention or access model of the native view.
The important distinction is between monitoring and observability. Monitoring reports known states such as failed, running, or throttled. Observability combines signals and context so a team can explain an unexpected state and act on it.
Representative Scenario: The Dashboard Is Current, Until It Is Not
Composite Scenario Note: The following scenario illustrates common operational disconnects across distributed analytics layers and is not a specific customer disclosure.
A regional services company uses Fabric for daily operational analytics. Data Factory pipelines ingest transactions and case-management data. Notebooks standardize records in a Lakehouse. A semantic model serves an executive Power BI dashboard before the morning operations call.
At 06:10, a source schema change causes one pipeline activity to fail. A retry succeeds at the pipeline level but omits one partition. The semantic-model operation completes against the incomplete Gold table. At 08:00, the dashboard opens normally and shows yesterday's totals for one region.
No single signal is enough:
- A binary pipeline-success alert would report recovery;
- A semantic-model completion alert would report success;
- The capacity view might show normal utilization; and
- The report itself would remain technically available.
The real breach is a business condition: the regional dataset is incomplete after its 07:15 freshness deadline.
A mature observability design therefore monitors a chain of promises: source arrival, ingestion completeness, transformation quality, publication time, semantic availability, and business freshness. Technical events provide evidence, but the data-product service-level objective determines whether the service is healthy.
Why This Problem Matters Now
Fabric's monitoring surface is expanding. Microsoft's workspace-monitoring documentation lists supported logs across Data Factory, Real-Time Intelligence, Mirroring, semantic models, GraphQL APIs, and Fabric job events. Workspace monitoring is still documented as preview, however, and its support is not uniform across every Fabric item or event type.
That combination matters. Enterprises can now build more native observability, but they must design for coverage gaps and change. A dashboard tied directly to today's preview schema is not an operating model. Contracts, ownership, tests, and fallback procedures are what keep the model stable as the platform evolves.
Five Root Causes of Operational Blind Spots
1. Tool-Centric Monitoring
Teams often organize alerts around products rather than services: pipeline alerts for data engineering, refresh alerts for BI, and capacity alerts for administrators. An incident then crosses those boundaries faster than the teams do. Consequence: mean time to diagnose (MTTD) increases because responders manually reconstruct the dependency chain.
2. No Business Service Catalogue
Fabric item metadata identifies technical objects, but it does not by itself express an executive dashboard's criticality, freshness deadline, business owner, technical owner, recovery objective, or approved maintenance window. Consequence: alert volume grows while prioritization remains subjective.
3. Success Is Defined as Process Completion
A green job can still publish incomplete, late, duplicated, or semantically invalid data. Conversely, a failed noncritical task may have no business effect. Consequence: teams optimize for job status rather than trustworthy decisions.
4. Capacity and Workload Signals Are Separated
Fabric capacity uses shared compute. Microsoft notes that sustained high demand can lead to operation delays or rejections, while background consumption is smoothed over time. The Capacity Metrics app can identify high-impact items and operations, but it does not know which business SLO is endangered. Consequence: teams may scale capacity before fixing an inefficient workload, or tune a workload without recognizing a genuine need for isolation or more capacity.
5. Retention and Access Are Assumed Rather Than Designed
Workspace monitoring currently retains monitoring data for 30 days. Its database is read-only and is accessible only to workspace users with at least the required workspace role. The monitoring hub also follows item permissions and its main activity view is bounded. Consequence: long-term reliability trends, audit evidence, and cross-workspace investigation may be incomplete unless the organization deliberately exports or aggregates the required data under an approved retention policy.
Why Common Approaches Fall Short
"Send an Email When Every Job Fails"
This creates noise, misses silent data-quality failures, and makes distribution lists the incident-management system. A useful alert needs criticality, ownership, deduplication, business impact, and an action.
"Use the Monitoring Hub as the Enterprise NOC"
The monitoring hub is valuable for interactive investigation. It shows activity according to the user's permissions, and Microsoft documents limits on the number and history of activities displayed in its main view. It is not a substitute for an enterprise service catalogue, durable history, or cross-team incident workflow.
"One Dashboard Will Unify Everything"
A visual can place signals side by side without correlating them. If item IDs, workspace IDs, job instances, capacity IDs, data-product identifiers, and owners are not mapped, responders still have to guess which events belong to the same service.
"Turn on Every Log First and Govern It Later"
Operational logs can expose item names, identities, timestamps, query details, error text, and workload patterns. Broad access may disclose sensitive operational context. Monitoring also consumes capacity, and indiscriminate high-frequency queries can create avoidable cost.
"Treat Preview as a Production Guarantee"
Preview features can be highly useful, but interfaces, schemas, coverage, and limitations can change. Critical operations need acceptance tests, schema-change detection, fallback access paths, and an explicit decision about acceptable preview dependency.
A Microsoft Fabric Observability Architecture
The architecture preserves the value of each native monitoring plane while adding a thin, governed layer that connects technical events to business services:
Fabric workloads and business checks
  |-- Pipelines, copy jobs, notebooks, semantic models
  |-- Eventstreams, Eventhouses, Mirroring, GraphQL APIs
  |-- Freshness, completeness, reconciliation, quality checks
  v
Native monitoring planes
  |-- Monitoring hub: current and recent job operations
  |-- Workspace monitoring: queryable item logs and metrics
  |-- Capacity Metrics app: CU use, overload and throttling
  |-- Admin monitoring: tenant inventory, use and adoption
  v
Operational correlation layer
  |-- Data-product and dependency catalogue
  |-- Stable IDs, environment, criticality and owners
  |-- SLO evaluations and maintenance-window context
  v
Response and learning
  |-- Activator or approved incident-management integration
  |-- Role-based dashboards and runbooks
  |-- Incident review, trend analysis and backlog
1. Start With a Service Catalogue
Define one record for every production data product or analytics service. At minimum, capture:
| Catalogue Field | Operational Purpose & Scope |
|---|---|
| ServiceId | Stable unique identifier independent of cosmetic display names. |
| BusinessOutcome | The critical business decision or automated process the service supports. |
| Criticality | Agreed priority tier (Tier 1 mission-critical down to Tier 3 exploratory). |
| BusinessOwner | Accountable business leader responsible for value, privacy, and risk. |
| TechnicalOwner | Engineering team responsible for triage, restoration, and runbooks. |
| WorkspaceId & ItemId | Exact GUIDs for automated correlation to Fabric telemetry streams. |
| CapacityId | Assigned F-capacity GUID for correlating compute pressure and throttling. |
| Environment | Deployment stage (Development, Test, or Production). |
| Dependencies | Explicit upstream sources, notebooks, lakehouses, semantic models, and reports. |
| FreshnessSLO | Latest acceptable data timestamp before an operational breach is triggered. |
| CompletenessRule | Expected row counts, partitions, or business reconciliation totals. |
| RecoveryTarget | Target recovery time objective (RTO) and recovery point objective (RPO). |
| RunbookUrl | Approved step-by-step restoration procedures and rollback paths. |
Always use immutable IDs for joins. Names are convenient display labels but change too easily across releases to serve as reliable join keys.
2. Use Each Native Plane for the Question It Answers
- Monitoring Hub (What is running or failing right now?): Human triage, recent run history, error details, and schedule-failure notifications. Remember that visibility follows workspace permissions.
- Workspace Monitoring (What happened inside this workspace?): Automated monitoring Eventhouse and read-only KQL database exposing job events and activity-level pipeline logs with status, duration, and error codes.
- Capacity Metrics App (Did shared compute contribute?): Distinguish background from interactive consumption, identify overload or throttling windows, and evaluate expensive CU operations.
- Admin Monitoring Workspace (What is changing across the tenant?): Feature usage, tenant inventory, and adoption patterns across a rolling 30-day window with daily refreshes.
3. Define SLOs From the Consumer's Perspective
A service-level objective (SLO) is a measurable reliability target. It should describe the outcome users need, not merely whether an internal component ran without an error code:
- Freshness: Approved executive sales data is refreshed and available by 07:15 local time on business days;
- Completeness: Every expected operating region and accounting period is present before Gold table publication;
- Availability: The certified semantic model responds to analytical queries within sub-second thresholds during peak decision windows;
- Latency: Priority streaming events in Real-Time Intelligence are queryable within 60 seconds of ingestion; and
- Quality: Critical reconciliation rules match upstream source ledgers within 0.01% or downstream publication is automatically halted.
Separate three states: healthy, at risk, and breached. Detecting an 'at risk' condition (such as an ingestion pipeline running 20 minutes longer than normal) creates time to intervene before the customer commitment fails.
4. Build Actionable Detection Logic
Start with a small set of high-value detections. A workspace-level pipeline-failure query might follow this shape:
ItemJobEventLogs
| where Timestamp > ago(10m)
| where ItemKind == "Pipeline" and JobStatus == "Failed"
| project Timestamp, WorkspaceId, ItemId, ItemName,
          JobInstanceId, CapacityId, ExecutingPrincipalId
The production rule should then join or look up service metadata, suppress approved maintenance, group repeated events, and produce one incident signal per affected service rather than one notification per log row.
Do not depend solely on failure events. Build explicit detection rules for: missing runs when sources do not arrive; duration anomalies outside normal operating envelopes; repeated retries; silent completeness and reconciliation failures; stale Gold tables; correlated capacity throttling; and monitoring silence when logs stop arriving entirely.
5. Make Alerts Carry an Operational Contract
Every production alert should contain: service name, environment, and criticality; breached or threatened SLO; first detected time and current state; affected Fabric workspace and item IDs; likely dependency or correlated capacity condition; business and technical owners; runbook link; and deduplication key.
Route by service ownership, not item creator. Use a central incident management platform when enterprise policy requires acknowledgment, on-call paging, escalation, and post-incident evidence.
6. Design Monitoring as a Production Service
Give the observability layer its own owner, access model, deployment path, tests, and recovery procedure. Monitor whether expected monitoring tables exist, whether records are arriving continuously, schema drifts in preview tables, and Eventhouse capacity consumption. This prevents silent monitoring failures from masking real platform outages.
Governance, Security, Adoption, and Cost
Governance
Assign decision rights. Platform engineering should own the shared framework; domain teams should own service metadata, SLOs, and first response; capacity administrators should own resource policy; and security and compliance should approve access and retention.
Security and Privacy
Apply least privilege to monitoring workspaces and dashboards. Operational logs can expose user identities, query text, error payloads, and source names. Workspace monitoring currently does not support private links, according to Microsoft documentation. Organizations requiring private-link-only access must account for this architecture constraint.
Adoption
Train owners on the service catalogue, severity model, dashboards, and runbooks. Run game days that simulate late data, capacity throttling, expired credentials, and a broken monitoring rule to build confidence across teams.
Cost and Capacity
Workspace monitoring consumes Fabric capacity units. Model costs across log volume, retention, query frequency, and alert evaluation. Keep raw operational detail for the shortest approved period, retain aggregated SLO history longer when needed, and evaluate workload optimization before scaling up compute.
A Phased Implementation Roadmap
Phase 1: Baseline and Ownership (Weeks 1-2)
- Inventory production workspaces, critical items, capacities, owners, and existing alerts;
- Select three to five high-value data products;
- Define SLOs, severity tiers, escalation, maintenance windows, and runbooks; and
- Document monitoring coverage gaps and establish a preview-feature policy.
Exit gate: Every pilot service has accountable owners, stable IDs, measurable SLOs, and an agreed response path.
Phase 2: Instrument and Correlate (Weeks 3-5)
- Enable approved native monitoring features in pilot workspaces;
- Configure the Capacity Metrics app and relevant admin monitoring views;
- Create the service catalogue and correlation mappings;
- Implement job, freshness, completeness, and capacity-context queries; and
- Protect telemetry with role-based access and approved retention.
Exit gate: Responders can trace a simulated business breach from service to item, job, dependency, and capacity context.
Phase 3: Alert and Operate (Weeks 6-8)
- Implement deduplicated, severity-aware alerting with Fabric Activator or incident tools;
- Connect critical signals to the approved incident workflow;
- Test acknowledgments, escalation, suppression, and notification failure; and
- Run incident simulations with domain, platform, capacity, and security teams.
Exit gate: Each pilot scenario produces one actionable incident with a correct owner and tested runbook.
Phase 4: Scale and Improve (Ongoing)
- Onboard services by business criticality, not workspace count;
- Automate catalogue and control validation in CI/CD deployment processes;
- Review recurring incidents and expensive capacity operations monthly;
- Revalidate preview schemas, product limitations, permissions, and costs after Fabric updates; and
- Convert repeated manual recovery steps into controlled automation.
Exit gate: Observability coverage becomes an automated production-readiness release gate for every critical Fabric service.
Success Metrics Scorecard
| Observability Metric | Operational Insight & Value |
|---|---|
| Percentage of critical services with an owner, SLO, and runbook | Operating-model coverage across the enterprise estate. |
| Percentage of SLO breaches detected before user report | Proactive detection rate versus consumer-reported outages. |
| Median time to acknowledge (MTTA) and restore (MTTR) by severity | Operational incident response and resolution effectiveness. |
| Alert-to-action ratio | Alert noise reduction and operational actionability. |
| Repeat incident rate by root cause | Durability of post-incident engineering remediation. |
| Freshness and completeness attainment | Overall business service reliability and SLA compliance. |
| Unowned or unmapped production items | Technical debt and governance exposure in the tenant. |
| Monitoring query and storage consumption | Observability capacity overhead relative to business compute. |
| Monitoring-silence test pass rate | Health and reliability of the telemetry collection pipeline. |
How YuniQ Can Help
YuniQ's published Microsoft Fabric consulting and implementation services align directly with establishing an enterprise observability operating model. Our Fabric Strategy & Readiness practice provides current-state workload diagnostics, capacity planning, workspace topology, and operating-model design. Our data engineering practice implements automated data-quality observability, schema validation, and exception handling.
For organizations moving into production operations, YuniQ's Fabric Managed Services provide continuous pipeline monitoring, capacity throttling and cost optimization, DevOps release management, and platform expansion. We connect business-critical service definitions with real-time Fabric telemetry and accountable incident workflows.
Build Your Fabric Enterprise Observability Model
Stop letting data consumers detect platform failures. Partner with YuniQ to implement end-to-end data product SLOs, workspace telemetry correlation, and automated incident runbooks.
Explore Microsoft Fabric ConsultingPractical Next Steps: 7-Step Implementation Plan
- Choose one dashboard or data product whose lateness would materially affect a business decision.
- Map its Fabric items, workspace, capacity, sources, downstream consumers, and owners using stable GUIDs.
- Write one freshness SLO and one completeness rule in business language.
- Compare the required signals with current Fabric monitoring coverage and documented limitations.
- Build one correlated incident path from detection through ownership and runbook.
- Simulate a failure, a silent data-quality defect, capacity contention, and monitoring silence.
- Measure detection, acknowledgment, diagnosis, restoration, noise, and capacity cost before scaling.