Microsoft retirement deadline for the legacy Excel and CSV import experience in the Power BI service has passed. Semantic models created through that experience stopped refreshing after July 31, 2026 , and stopped loading after August 31, 2026 . Reports bound to those models can now show stale data or fail to open. Excel and CSV remain supported data sources; the retired component is the old import path, not the file formats themselves.
Core Governance Principle: The goal of recovering legacy file-based reporting is not to force every spreadsheet into a complex lakehouse. It is to give each workload a deliberate home, a named owner, a measurable freshness commitment, and a controlled retirement path.
For an enterprise, this is not merely a report-repair exercise. Legacy file imports often sit outside normal ownership, release, monitoring, and data-governance processes. Recreating every affected report in the quickest available way can restore the exact same operational weakness under a new connector.
The disciplined enterprise response operates at two distinct speeds:
- Contain the business impact: inventory affected semantic models, rank them by decision criticality, preserve source files and business logic, and rebuild the minimum viable path for priority reports.
- Remove the structural risk: route recurring file feeds through an appropriate governed pattern in Microsoft Fabric, separate raw evidence from validated data, publish an owned semantic model, and monitor freshness as a business service level objective (SLO).
The Enterprise Problem: A Small Technical Retirement Hiding a Large Reporting Dependency
The legacy experience created semantic models directly from Excel or CSV files uploaded through the Power BI service interface. Microsoft documents three unambiguous operational signs of an affected model: it cannot be edited in the browser , cannot be downloaded as a PBIX file , and has no scheduled-refresh option in workspace settings.
Administrators and engineers can query the Power BI REST APIs for workspace datasets and inspect ContentProviderType . Values of Excel or CSV identify semantic models created through the retired experience.
This architectural retirement exposes a deceptively complex enterprise problem:
- Terminology confusion: The broken asset may be classified as a 'dataset' in older inventories, a 'semantic model' in the current Fabric service, and a 'spreadsheet report' by frontline business teams.
- Silent failure: The source file on OneDrive or SharePoint continues to be updated, giving analysts the false impression that reporting remains active.
- Orphaned ownership: The original creator may have transferred teams, left the organization, or lost administrative workspace access.
- Undocumented blast radius: Multiple executive dashboards, scheduled email subscriptions, and downstream paginated reports frequently depend on a single unmonitored model.
- Buried business logic: Crucial transformation rules, exception logic, currency conversions, and metric measures exist only in legacy Power Query M-code or unrecorded manual steps.
The real danger is decision failure : corporate leaders make resource allocations on stale metrics, teams assemble conflicting versions under boardroom pressure, and compliance functions lose the audit trail linking published financial KPIs back to raw evidentiary files.
Representative Scenario: The Weekly Operations Pack No Longer Opens
Operational Case Context: A distributed services organization receives weekly staffing, backlog, and billing files from 18 regional units. Local analysts drop workbooks into shared SharePoint folders, feeding Power BI dashboards for Monday morning executive reviews. Three legacy semantic models abruptly fail to load. While raw files arrive on schedule, nobody can identify which workbook version, transformation script, or credential produced the published totals.
The immediate executive demand is always 'fix the dashboard.' However, experienced enterprise architects recognize the essential architectural questions that must be addressed first:
- Which operational decisions are currently blocked, and what is the exact deadline for the next governance review?
- Which specific report, semantic model, workbook path, workspace, owner, and audience group belong to this reporting chain?
- How can the last trusted historical output be preserved without being mistaken for current operational data?
- Is this file upload a temporary data interchange, a permanent business-controlled input, or a fragile workaround for missing ERP integration?
- Should the target architecture remain a supported Power BI desktop connection, leverage Dataflow Gen2, or transition into a governed OneLake medallion data product?
Root Causes and Architectural Consequences
1. Asset Inventories Stop at the Presentation Layer
Many enterprise catalogs list report names and visual owners but omit source-file URLs, semantic-model GUIDs, refresh schedules, subscriber distribution lists, sensitivity classifications, and upstream manual preparation routines. When a model fails, incident responders cannot assess the blast radius.
2. File Movement Mistaken for Data Engineering
Overwriting a workbook in SharePoint or email is not an engineered data pipeline. Sheet names, column headers, localized decimal formats, and submission timestamps shift unpredictably. A successful file copy provides zero validation regarding completeness or semantic integrity.
3. Business Logic Lacks Durable Ownership
Vital transformations accumulate invisibly in Power Query scripts, nested Excel macros, or desktop measures. When ownership is tied to an individual user account rather than a governed corporate service identity, the company inherits an unmaintainable shadow application.
4. Data Freshness Assumed Instead of Measured
A Power BI dashboard can render flawlessly while presenting data that is weeks out of date. Technical pipeline completion, gateway synchronization, model refresh, and business-period currency are separate states. Monitoring only dataset refresh status misses late or incomplete upstream file submissions.
5. Crisis Pressure Collapses Data Governance
Facing leadership deadlines, teams frequently deploy panic workarounds: publishing parallel uncertified reports, granting widespread workspace admin roles, embedding personal credentials, and skipping reconciliation checks. These shortcuts create severe data sprawl and security exposure.
Why Common Emergency Responses Fall Short
When legacy imports stop working, organizations often jump to instinctive fixes that fail to solve the underlying systemic risk:
- 'Just reconnect the spreadsheet': Valid for a tiny, isolated personal workbook, but disastrous when multiple submitters or reports depend on the file. It restores temporary visuals without establishing lineage, automated schema validation, or recovery runbooks.
- 'Move every file into OneLake immediately': Centralization without curation merely creates a new data swamp. Dumping hundreds of unclassified, unvalidated spreadsheets into lakehouse storage inflates Fabric capacity consumption without improving governance.
- 'Rebuild the front-end report visuals first': Visuals are merely downstream projections. Reconstructing visual tiles before verifying column calculations, boundary conditions, and historic reconciliation creates a polished dashboard displaying incorrect metrics.
- 'Use the last PDF export as the source of truth': A static export provides temporary business continuity if labeled as historical, but it cannot support forward decision-making and must never be quietly republished as current production data.
- 'Assume a green refresh status means healthy data': In Power BI Import mode, a green checkmark merely indicates that the engine processed the input payload. It does not verify whether the workbook contained the correct week data or whether rows were dropped.
A Two-Speed Microsoft Fabric Solution
Step 1: Establish a Recovery Control Room
Construct a centralized incident register covering every affected workspace. Before touching report code, capture these nine mandatory parameters for each impacted asset:
| Inventory Field | Governance & Recovery Purpose |
|---|---|
| Workspace, Report, and Semantic Model GUID | Eliminates name-based ambiguity across dev, test, and prod environments. |
| ContentProviderType Flag | Identifies whether the asset was built via the retired Excel or CSV import pipeline. |
| Business Owner & Technical Steward | Separates business decision accountability from engineering maintenance. |
| Source File Path, Submitter & Cadence | Reconstructs the upstream data contract, folder location, and delivery schedule. |
| Last Trusted Business Date | Prevents stale historical records from masquerading as current operations. |
| Downstream Consumers & Subscriptions | Defines the exact audience, executive recipients, and automated report exports. |
| Data Sensitivity & Security Group | Enforces least-privilege access and Purview sensitivity labels during recovery. |
| Decision Criticality & Next Deadline | Determines the prioritization queue for emergency reconstruction. |
| Target Pattern & Retirement Gate | Prevents temporary band-aids from hardening into permanent technical debt. |
Score each workload across business criticality, data sensitivity, consumer breadth, and recovery complexity. Rebuild high-criticality, high-confidence models first. Any critical asset with ambiguous transformation logic must undergo structured validation rather than an unverified same-day patch.
Step 2: Choose the Smallest Adequate Target Pattern
Avoid one-size-fits-all overengineering. Match each file workload to the smallest architecture that delivers required governance:
Pattern A: Supported Power BI File Connection. Appropriate for isolated, single-owner files with basic logic, low reuse, and weekly or monthly refresh cadences. Author the model in Power BI Desktop connecting to OneDrive or SharePoint, publish to a governed workspace, configure scheduled refresh with service credentials, and establish failure alert distribution lists.
Pattern B: Dataflow Gen2 for Departmental Ingestion. Ideal when multiple operational files share identical schemas, Power Query M transformations must be shared across several models, or files are submitted by multiple regional teams. Use Fabric SharePoint Folder connector authenticated via Workspace Identity to eliminate individual user credential dependencies.
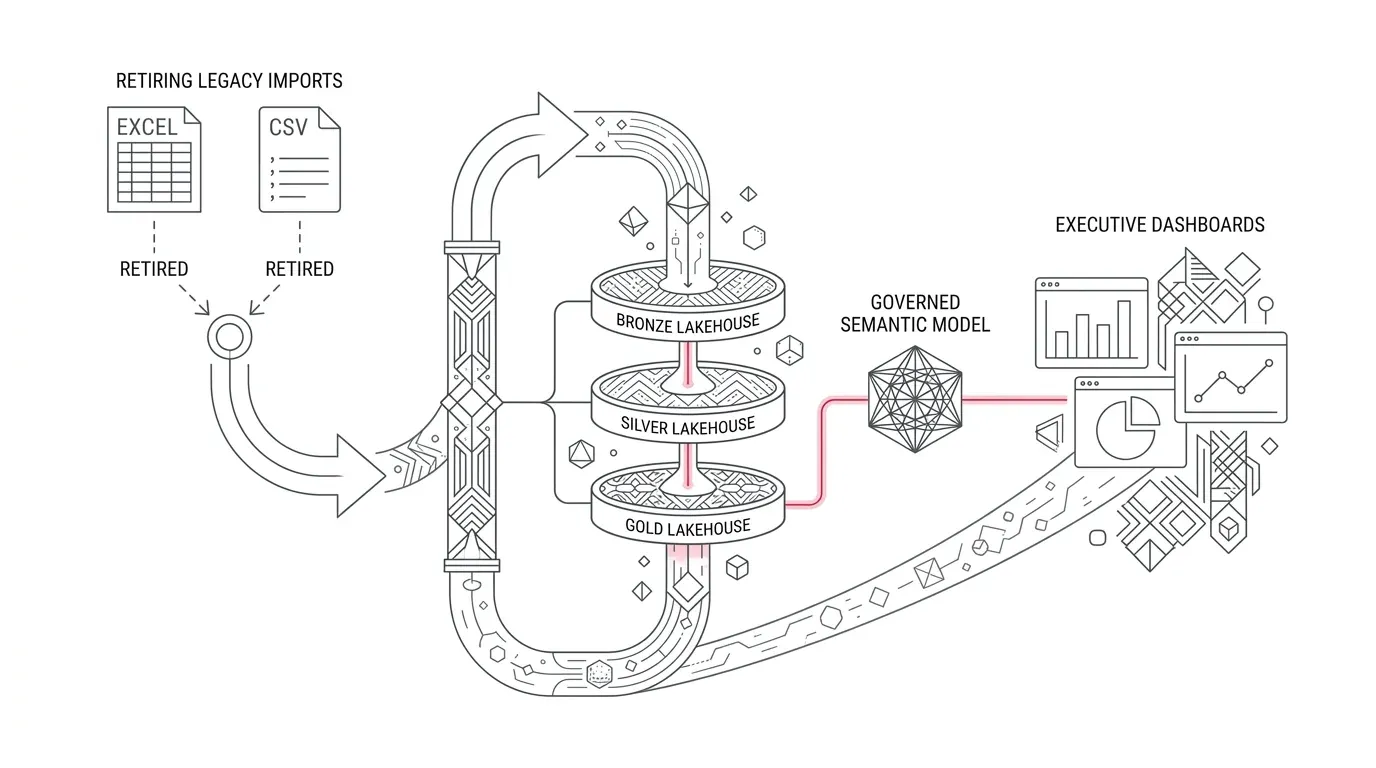
Pattern C: Governed OneLake Medallion Data Product . Mandatory for executive KPIs, regulatory disclosures, enterprise master data, high-volume files, or multi-year historical reporting. The file serves as an audited input contract feeding a multi-tier Fabric lakehouse:
Approved File Location (SharePoint / ADLS Gen2 / Fabric OneLake)
        |
        v
Fabric Data Factory Pipeline or Dataflow Gen2
        |
        v
Bronze Lakehouse: Immutable raw files + ingestion metadata + file hash
        |
        v
Silver Lakehouse: Cleaned schemas, standardized types, deduplication & quality gates
        |
        v
Gold Lakehouse: Star schema, business dimensions, certified facts & measures
        |
        v
Governed Semantic Model (Direct Lake / Import) -> Certified Executive Dashboards
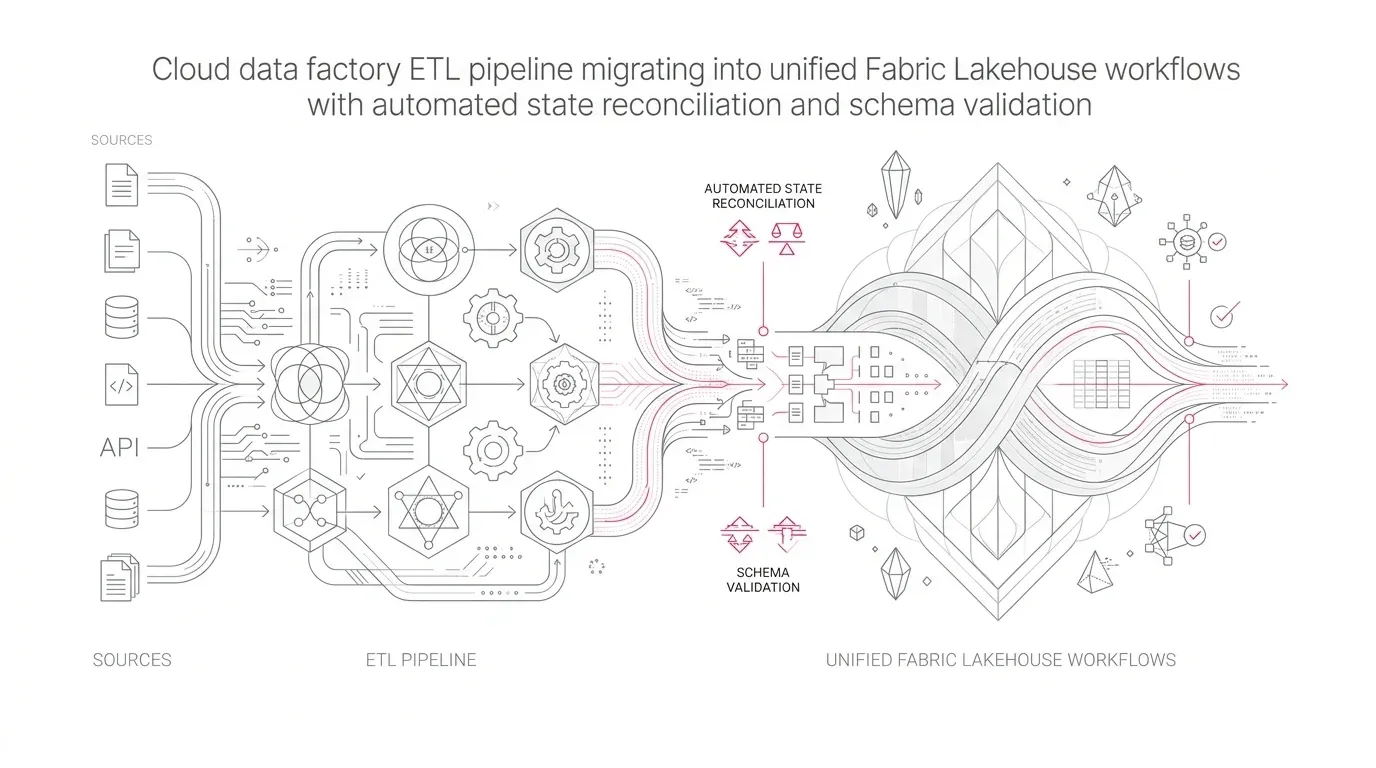
For every production file ingested into Pattern C, maintain an automated ingestion control table tracking source file name, SHA-256 content hash, received timestamp, processed timestamp, reporting period, submitting entity, schema version, accepted/quarantined status, row count, and pipeline run ID. This converts casual spreadsheet sharing into auditable enterprise evidence.
Step 3: Rebuild the Semantic Contract Before Visuals
Never build report charts until underlying semantic contracts are formally certified. Re-establish and document:
- Canonical business definitions for all published KPIs and measures;
- Model grain, primary keys, dimensional relationships, and calendar tables;
- Handling of late-arriving records, restatements, and multi-currency conversions;
- Row-level security (RLS) and object-level security (OLS) role assignments; and
- Storage mode selection: Direct Lake over Delta Parquet for real-time scale, or scheduled Import mode when complex M-transforms remain necessary.
Reconcile every recovered model across three strict validation checkpoints: input control totals (file record count vs. lakehouse landed rows), transformation reconciliation (handling of discarded duplicates and join exclusions), and output consistency (comparing measures against the last verified production baseline).
Step 4: Make Lineage and Release Evidence Mandatory for Cutover
Leverage Fabric Impact Analysis to map all connected downstream reports, apps, and workspaces before promoting changes. Enforce strict environment isolation across Development, Test, and Production workspaces.
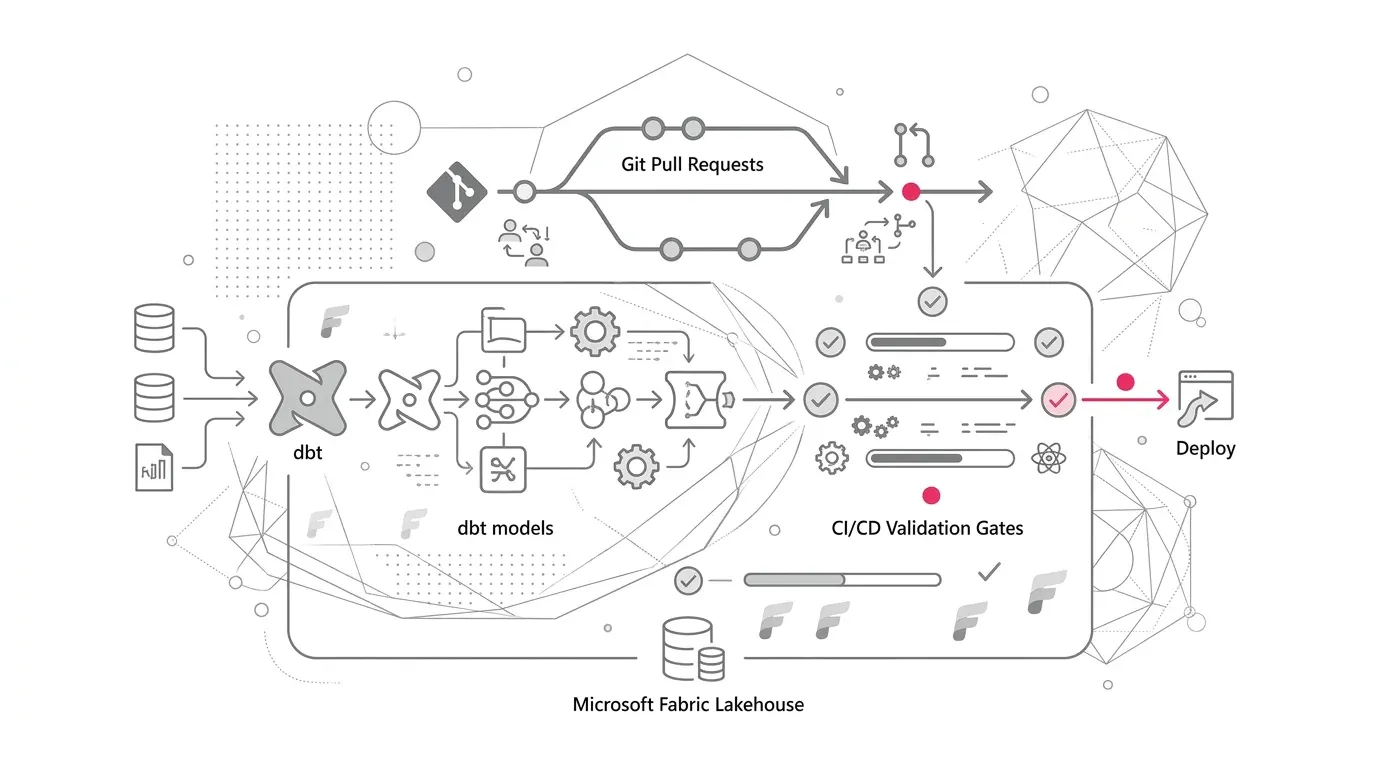
Deploy models through Fabric deployment pipelines or Git integration backed by Azure DevOps. Require mandatory release documentation before cutover: documented change logs, automated reconciliation test logs, security RLS verification, Fabric capacity impact estimates, and formal business sign-off.
Step 5: Monitor Freshness as an End-to-End Chain
Establish automated telemetry across four sequential timestamps: Expected Arrival, Ingestion Received, Data Product Published, and Semantic Model Refreshed. This granular instrumentation immediately pinpoints whether reporting delays stem from late business submissions, pipeline throttling, or model processing.
Configure alert notifications on Business Service Level Objective (SLO) breaches rather than isolated transient task failures. A pipeline that completes successfully but ingests yesterday stale data is a high-priority business incident.
Phased Implementation Roadmap
Phase 0: Containment & Discovery (Hours 0–48)
Publish clear operational status tags across affected executive reports (Current, Stale, Under Validation, or Temporarily Offline). Secure all raw source workbooks, last trusted PDF exports, and workspace metadata. Scan tenant datasets via REST API for ContentProviderType matches, halt rogue manual republishing, and establish controlled manual continuity where necessary.
Phase 0 Exit Gate : Every broken critical dashboard has an identified business sponsor, a declared data validity date, and an assigned recovery path.
Phase 1: Reconstruction & Prioritization (Days 2–10)
Map reports to underlying semantic models, data contracts, and decision deadlines. Catalog business logic and classify workloads into Pattern A, B, or C. Formulate data quality contracts, schema definitions, and capacity consumption estimates.
Phase 1 Exit Gate : Critical recovery backlog is ordered by business risk, with approved architectural patterns assigned to each asset.
Phase 2: Rebuild & Parallel Validation (Weeks 2–6)
Develop ingestion pipelines, lakehouse tables, and semantic models inside Development workspaces. Execute test runs against valid, malformed, duplicate, and missing file payloads. Perform rigorous data reconciliation against historical periods, validate row-level security roles, and verify automated failure alerts.
Phase 2 Exit Gate : Business and technical stewards execute formal sign-off confirming calculation parity, security boundaries, and operational stability.
Phase 3: Production Cutover & Retirement (Weeks 4–8)
Promote data products through deployment pipelines to Production. Rebind client reports to new certified semantic models. Notify stakeholders, update data dictionary documentation, and permanently delete retired legacy datasets and broken workarounds.
Phase 3 Exit Gate : Zero production consumers depend on retired legacy models, and all temporary emergency measures are decommissioned.
Phase 4: Durable Operational Governance (Ongoing)
Incorporate recovered assets into the enterprise data product catalog. Continuously monitor freshness SLOs and capacity utilization using the Fabric Capacity Metrics App. Apply Fabric endorsement and certification tags exclusively to validated data products, and evaluate high-volume recurring file feeds for direct API integration.
Governance, Security, Adoption, and Capacity Decisions
| Governance Domain | Mandatory Architectural Control | Operational Failure Prevented |
|---|---|---|
| Ownership Governance | Designated business and technical owners; end-to-end lineage; certification gate. | Orphaned, unmaintained, or contradictory semantic models. |
| Security & Compliance | Least-privilege workspace roles; approved cloud storage; Purview sensitivity labels; tested RLS. | Uncontrolled copies exposing sensitive PII or payroll figures. |
| Identity Architecture | Workspace Identity or managed enterprise connections; elimination of personal user accounts. | Silent pipeline failure when an employee departs or credentials rotate. |
| Data Quality & Validation | Automated schema enforcement, record count verification, duplicate detection, and quarantine zones. | Publication of truncated, corrupted, or structurally shifted files. |
| User Adoption | Visible data freshness badges, clear steward contacts, and certified item endorsement. | Frustrated business users retreating to unmanaged desktop spreadsheets. |
| Release Engineering | Strict Dev/Test/Prod workspace segregation, automated visual diffing, and rollback procedures. | Emergency hotfixes introducing regression bugs into production dashboards. |
| Capacity Optimization | Right-sized architectural patterns, off-peak refresh scheduling, and telemetry monitoring. | Spiking Fabric Capacity Units (CU) and compute throttling caused by duplicate jobs. |
Measuring Enterprise Recovery Success
Track empirical operational metrics throughout recovery rather than superficial counts:
- Discovery Coverage: Percentage of tenant workspaces scanned and legacy models dispositioned.
- Critical Service Availability: Percentage of high-priority executive dashboards restored with certified current data.
- Freshness SLO Attainment: Percentage of reporting refresh cycles completing within agreed business service windows.
- Reconciliation Pass Rate: Percentage of migrations achieving 100% mathematical parity across input, transformation, and measure calculations.
- Ownership Stewardship: Percentage of active production models possessing active business and technical stewards.
- Security Access Verification: Percentage of recovered datasets passing positive and negative role-based access audits.
- Technical Debt Elimination: Number of temporary recovery copies, redundant workspaces, and deprecated models successfully retired.
- Compute Capacity Efficiency: Normalized Fabric Capacity Units (CUs) consumed per reporting cycle.
- User Migration Rate: Percentage of business consumers utilizing certified Fabric apps rather than manual spreadsheet exports.
- Mean Time to Detect (MTTD) Stale Data: Elapsed duration from missed file submission to automated incident triage.
How YuniQ Accelerates Microsoft Fabric Modernization
YuniQ delivers end-to-end consulting and implementation services for enterprise Microsoft Fabric modernization across four core competencies:
- Discovery, Architecture & Health Checks: Comprehensive tenant diagnostics, Power BI semantic model inventory, gateway optimization, Fabric capacity sizing, and workspace topology design.
- OneLake Medallion Engineering: Data Factory pipelines, Dataflow Gen2 engineering, Lakehouse and Data Warehouse construction, and optimized Delta Parquet storage.
- Controlled Production Migration: Phased wave planning, automated reconciliation testing, parallel validation runs, and zero-downtime report cutovers.
- Enterprise Governance & Operations: Microsoft Purview sensitivity labeling, fine-grained access security, CI/CD deployment pipelines, automated freshness alerting, and Fabric capacity cost optimization.
Modernize Broken Power BI File Imports with Microsoft Fabric
Don't allow legacy Power BI import retirements to jeopardize executive decisions or leave your team stranded with fragile spreadsheet workarounds. Partner with YuniQ for an enterprise recovery diagnostic, governed medallion lakehouse engineering, and certified semantic modeling.
Explore Microsoft Fabric ConsultingPractical Next Steps for Enterprise Teams
- Generate an immediate tenant inventory of all semantic models where ContentProviderType is Excel or CSV.
- Enrich the inventory with business stewards, decision deadlines, last trusted dates, source file paths, and downstream audiences.
- Publish transparent status tags across all affected reports (Current, Stale, Under Review, or Offline).
- Select the appropriate target pattern (Pattern A, B, or C) for the top five mission-critical reporting workloads.
- Execute an end-to-end pilot migration for one critical workload, validating data reconciliation, security roles, and retirement gates.
- Scale the proven pattern across the remaining backlog, retiring legacy objects and establishing a permanent, governed data foundation.